Brisbane sees wettest month since 1893
February 2022:
Brisbane has seen the wettest month since February 1893 and the second wettest month on record as 887.0 mm of rain fell at the official station this month, much of it within the last 3 days during the Queensland,New South Wales heavy rainfall and flooding episode. It was Brisbane's highest 3 day total rainfall on record as 676.8 mm of rain fell in the past 3 days which was almost 70% of Brisbane's average annual rainfall breaking the previous record of 600.4 mm in 1974. Brisbane saw 795 mm in the 7 days prior to 9 AM Monday making it Brisbane's wettest week on record breaking the record of 661.4 mm in 1974. Brisbane has also seen the wettest summer since the summer of 1970-1971, thus effectively being wetter than the 2010-2011 summer.
Brisbane's wettest month and February on record was February 1893 in which 1025.9 mm of rain fell but the rain was more dispersed throughout the month as opposed to concentrated within a few days like the past few days.
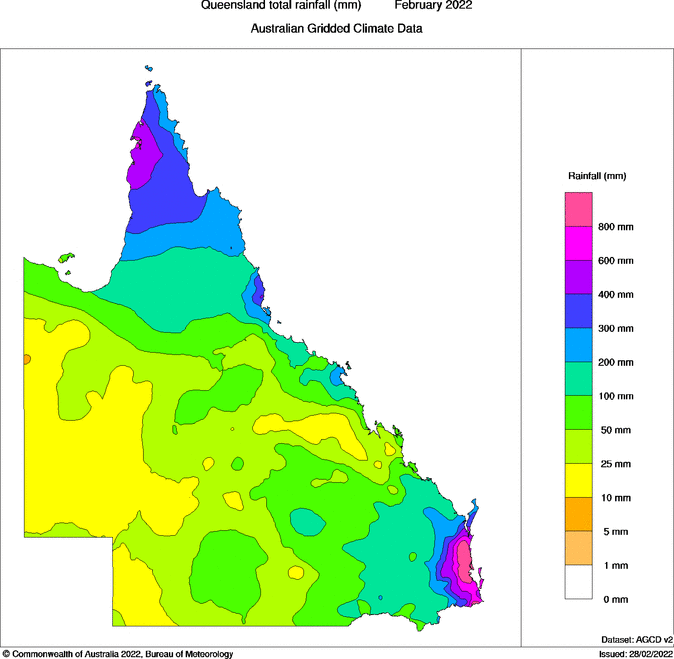
Queensland and New South Wales has been hit by an intense heavy rainfall and flooding episode in which near continuous rainfall has been failing over many places associated with moist low level wind convergence towards surface troughs and a developing east coast low coupled with lifting ahead of a stalling upper level trough to the west. 709 mm of rain fell in the 24 hours to 9 AM Saturday at Mt Glorious which was highest daily rainfall observed anywhere in Australia for 23 years beating rainfall amounts seen even in the most ferocious tropical cyclones and intense monsoon surges. The station over the hills just to the northwest of Brisbane recorded 1139 mm of rain within less than 48 hours which is more than the city's average annual rainfall. Parts of Queensland have experienced their worst floods in more than a century.
Dunoon just around 20 km north of Lismore saw 775 mm of rain in the 24 hours to 9 AM Monday making it the second highest daily rainfall ever observed in New South Wales beaten only by 809.2 mm at Dorrigo in February 1954 . The Wilsons River at Lismore recorded the highest levels on record there breaking the previous record set in 1954.
Severe weather warnings from the Bureau of Meteorology (BOM) are still in effect.
La Niña likely played a role in these heavy rainfall and flooding episode. There was also La Niña during the devastating 2010-2011 floods along with the devastating floods in 1974 and 1893. All 5 of Brisbane's wettest months on record are thought to have occurred during La Niña.
Climate change is leading to more intense and frequent floods in many regions of the world due to a combination of higher background water level and a warmer atmosphere being able to hold more moisture and thus produce heavier rainfall. Certain weather systems bringing heavy rainfall are also more likely with climate change. A formal attribution study would need to be done to determine the role of climate change in this heavy rainfall and flooding episode.
Brisbane February rainfall timeseries:
Brisbane has seen the wettest month since February 1893 and the second wettest month on record as 887.0 mm of rain fell at the official station this month, much of it within the last 3 days during the Queensland,New South Wales heavy rainfall and flooding episode. It was Brisbane's highest 3 day total rainfall on record as 676.8 mm of rain fell in the past 3 days which was almost 70% of Brisbane's average annual rainfall breaking the previous record of 600.4 mm in 1974. Brisbane saw 795 mm in the 7 days prior to 9 AM Monday making it Brisbane's wettest week on record breaking the record of 661.4 mm in 1974. Brisbane has also seen the wettest summer since the summer of 1970-1971, thus effectively being wetter than the 2010-2011 summer.
Brisbane's wettest month and February on record was February 1893 in which 1025.9 mm of rain fell but the rain was more dispersed throughout the month as opposed to concentrated within a few days like the past few days.
Queensland and New South Wales has been hit by an intense heavy rainfall and flooding episode in which near continuous rainfall has been failing over many places associated with moist low level wind convergence towards surface troughs and a developing east coast low coupled with lifting ahead of a stalling upper level trough to the west. 709 mm of rain fell in the 24 hours to 9 AM Saturday at Mt Glorious which was highest daily rainfall observed anywhere in Australia for 23 years beating rainfall amounts seen even in the most ferocious tropical cyclones and intense monsoon surges. The station over the hills just to the northwest of Brisbane recorded 1139 mm of rain within less than 48 hours which is more than the city's average annual rainfall. Parts of Queensland have experienced their worst floods in more than a century.
Dunoon just around 20 km north of Lismore saw 775 mm of rain in the 24 hours to 9 AM Monday making it the second highest daily rainfall ever observed in New South Wales beaten only by 809.2 mm at Dorrigo in February 1954 . The Wilsons River at Lismore recorded the highest levels on record there breaking the previous record set in 1954.
Severe weather warnings from the Bureau of Meteorology (BOM) are still in effect.
La Niña likely played a role in these heavy rainfall and flooding episode. There was also La Niña during the devastating 2010-2011 floods along with the devastating floods in 1974 and 1893. All 5 of Brisbane's wettest months on record are thought to have occurred during La Niña.
Climate change is leading to more intense and frequent floods in many regions of the world due to a combination of higher background water level and a warmer atmosphere being able to hold more moisture and thus produce heavier rainfall. Certain weather systems bringing heavy rainfall are also more likely with climate change. A formal attribution study would need to be done to determine the role of climate change in this heavy rainfall and flooding episode.
Brisbane February rainfall timeseries:

Brisbane maximum monthly rainfall timeseries:

Brisbane summer rainfall timeseries:

Total rainfall over Queensland this February:
Total rainfall over Queensland over the past week:
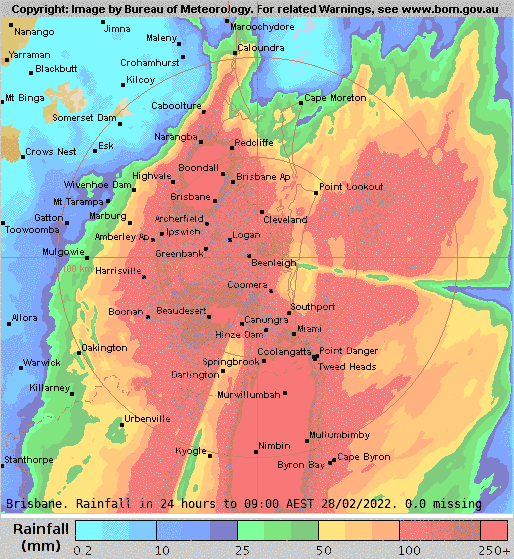
Radar derived 24 hours rainfall accumulation in the 24 hours to 9 AM Monday:
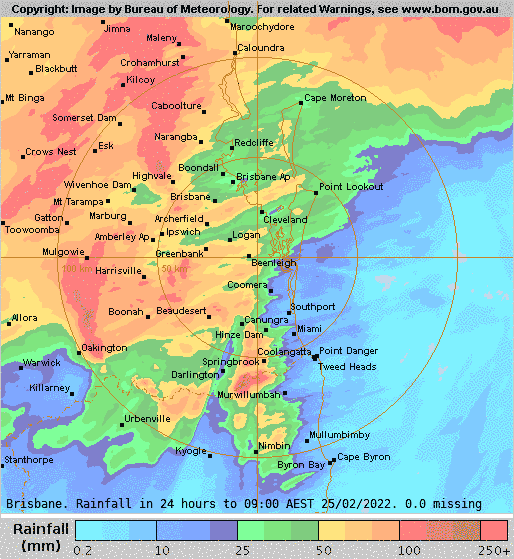
Radar derived 24 hours rainfall accumulation in the 24 hours to 9 AM Sunday:

Radar derived 24 hours rainfall accumulation in the 24 hours to 9 AM Saturday:

Radar derived 24 hours rainfall accumulation in the 24 hours to 9 AM Friday:

Radar derived 24 hours rainfall accumulation in the 24 hours to 9 AM Thursday:

Moist low level wind convergence near Brisbane:

Upper level divergence ahead of a stalling upper level trough:

Image courtesy of Meteologix.
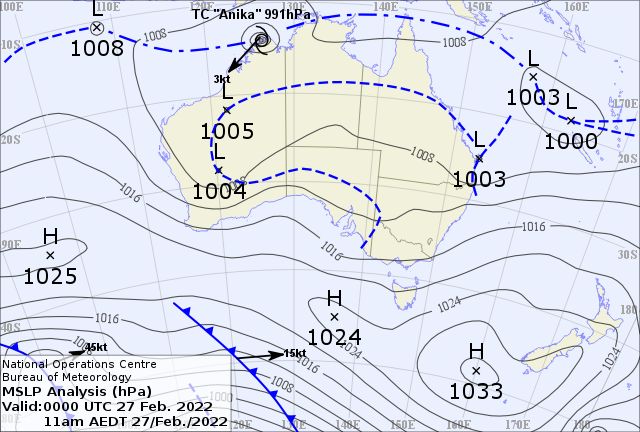
Seemingly benign surface chart illustrating the importance of dynamics aloft:
Trends in maximum 3-day rainfall in summer (December-February) from 1959/1960 to 2019/2020:
Trends in maximum 3-day rainfall in summer (December-February) from 1959/1960 to 2019/2020:

Images and data are from the Bureau of Meteorology (BOM). The final image is from The Conversation.