Australia's hottest and driest year on record
Australia has seen its warmest year on record and also the driest year on record in 2019.
Mean temperature was 1.52°C above average while mean maximum temperature was 2.09°C above average.
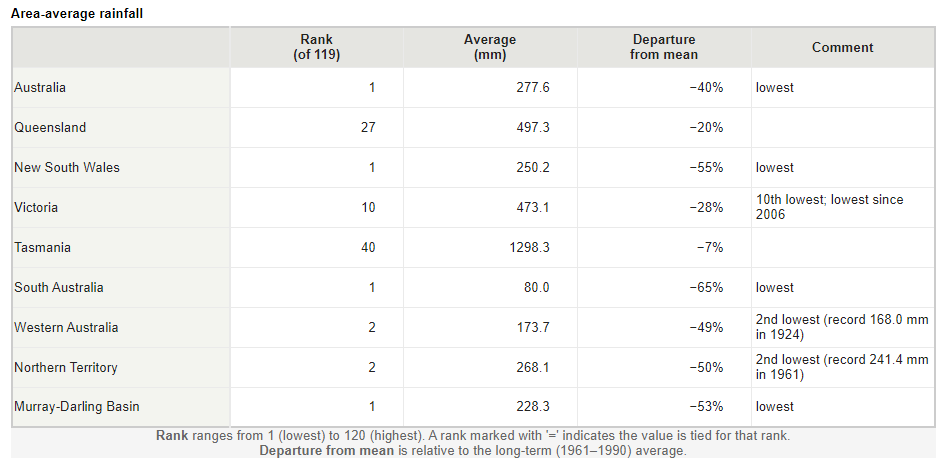
Australia wide average rainfall was around 40% below average at around 278 mm beating the previous record of around 315 mm in 1902 during the Federation Drought.
2019 also saw the highest national annual accumulated Forest Fire Danger Index since records began in 1950.
The 2010s decade was the warmest on record with the global warming trend continuing.
Western Australia and New South Wales/Australian Capital Territory also saw their warmest year on record.
Australia also saw the warmest summer on record during the 2018-2019 summer.
New South Wales, South Australia and the Murray Darling Basin also experienced their driest year on record. Western Australia and the Northern Territory both saw their 2nd driest year on record.
Perth, Sydney, Canberra and Hobart all saw their highest annual mean maximum temperature on record, drawing with 2011 and 2012 for Perth.
Despite the high temperatures, parts of Australia saw below average minimum temperatures during winter.
Glen Innes in New South Wales saw the third lowest temperature on record at -12.3°C on July 19th.
This is because dry conditions, clear skies and light winds lead to enhanced raditional cooling at night with increasing diurnal temperature range.
New South Wales and South Australia both saw their driest year on record with New South Wales having around only 250.2 mm of rain which is 55% below average, beating the previous record of 302.7 mm in 1944 during the World War II drought.South Australia had only around 80 mm of rain which is 65% below average and beats the record of 111.4 mm of rain set in 1944 during the World War II drought. The Murray Darling Basin also experienced their driest year on record with only around 228.3 mm of rain which was 53% below average and beats the record of 258.1 mm of rain in 1902 during the Federation Drought.
Western Australia and the Northern Territory observed their second driest year on record with Western Australia recording around 173.7 mm of rain which is 49% below average with the record being 168.0 mm of rain in 1924 and the Northern Territory recording around 268.1 mm of rain which was 50% below average with the record being 241.4 mm of rain in 1961.
All states and territories recorded below average rainfall.
The hot conditions are due to natural climate variability on top of anthropogenic climate change, one of the strongest positive Indian Ocean Dipole(IOD) years along with a sudden stratospheric warming(SSW) event in late winter leading to a prolonged period of negative Southern Annular Mode(SAM) partly responsible for the hot conditions in addition to dry soils favouring higher daytime temperatures.
One of the strongest positive Indian Ocean Dipole(IOD) years along with a sudden stratospheric warming(SSW) event in late winter leading to a prolonged period of negative Southern Annular Mode(SAM) were partly responsible for the dry conditions.
Anthropogenic climate change is expected to lead to increases in temperature across virtually all of Australia and also lead to drying of southwestern Australia and also parts of the south and southeast particularly during winter as the Southern Annular Mode(SAM) becomes more positive on average and the westerlies contracts southwards, fire danger is also expected to increase along with a longer fire season on average over large parts of Australia but not all.
However, the decreased rainfall in New South Wales and parts of Eastern Australia in recent years is difficult to separate from natural variability and future changes are uncertain.
Northern Australia appears to be seeing an increasing trend in rainfall but it is unclear whether this trend would continue in the future and positive Indian Ocean Dipole(IOD) events may increase in frequency in the future due to anthropogenic climate change.
Australian mean temperature timeseries (image from BOM):
Mean temperature was 1.52°C above average while mean maximum temperature was 2.09°C above average.
Australia wide average rainfall was around 40% below average at around 278 mm beating the previous record of around 315 mm in 1902 during the Federation Drought.
2019 also saw the highest national annual accumulated Forest Fire Danger Index since records began in 1950.
The 2010s decade was the warmest on record with the global warming trend continuing.
Western Australia and New South Wales/Australian Capital Territory also saw their warmest year on record.
Australia also saw the warmest summer on record during the 2018-2019 summer.
New South Wales, South Australia and the Murray Darling Basin also experienced their driest year on record. Western Australia and the Northern Territory both saw their 2nd driest year on record.
Perth, Sydney, Canberra and Hobart all saw their highest annual mean maximum temperature on record, drawing with 2011 and 2012 for Perth.
Despite the high temperatures, parts of Australia saw below average minimum temperatures during winter.
Glen Innes in New South Wales saw the third lowest temperature on record at -12.3°C on July 19th.
This is because dry conditions, clear skies and light winds lead to enhanced raditional cooling at night with increasing diurnal temperature range.
New South Wales and South Australia both saw their driest year on record with New South Wales having around only 250.2 mm of rain which is 55% below average, beating the previous record of 302.7 mm in 1944 during the World War II drought.South Australia had only around 80 mm of rain which is 65% below average and beats the record of 111.4 mm of rain set in 1944 during the World War II drought. The Murray Darling Basin also experienced their driest year on record with only around 228.3 mm of rain which was 53% below average and beats the record of 258.1 mm of rain in 1902 during the Federation Drought.
Western Australia and the Northern Territory observed their second driest year on record with Western Australia recording around 173.7 mm of rain which is 49% below average with the record being 168.0 mm of rain in 1924 and the Northern Territory recording around 268.1 mm of rain which was 50% below average with the record being 241.4 mm of rain in 1961.
All states and territories recorded below average rainfall.
The hot conditions are due to natural climate variability on top of anthropogenic climate change, one of the strongest positive Indian Ocean Dipole(IOD) years along with a sudden stratospheric warming(SSW) event in late winter leading to a prolonged period of negative Southern Annular Mode(SAM) partly responsible for the hot conditions in addition to dry soils favouring higher daytime temperatures.
One of the strongest positive Indian Ocean Dipole(IOD) years along with a sudden stratospheric warming(SSW) event in late winter leading to a prolonged period of negative Southern Annular Mode(SAM) were partly responsible for the dry conditions.
Anthropogenic climate change is expected to lead to increases in temperature across virtually all of Australia and also lead to drying of southwestern Australia and also parts of the south and southeast particularly during winter as the Southern Annular Mode(SAM) becomes more positive on average and the westerlies contracts southwards, fire danger is also expected to increase along with a longer fire season on average over large parts of Australia but not all.
However, the decreased rainfall in New South Wales and parts of Eastern Australia in recent years is difficult to separate from natural variability and future changes are uncertain.
Northern Australia appears to be seeing an increasing trend in rainfall but it is unclear whether this trend would continue in the future and positive Indian Ocean Dipole(IOD) events may increase in frequency in the future due to anthropogenic climate change.
Australian mean temperature timeseries (image from BOM):

Australian rainfall timeseries (image from BOM):

Australian rainfall by month compared to average (image from BOM):

Australian mean temperature anomaly map:

Australian mean temperature deciles:

Australian rainfall anomalies:

Australian rainfall deciles:

Much of Australia is in drought:

Australian rainfall by region:
Indian Ocean Dipole timeseries:
